I wanted to share a performance optimization step by step on a game so here it is. This is a third-person shooter which means it is viewed from the player's perspective more or less. This is important when optimizing. The camera view defines the way we set things up during optimization
This project has a very bad frame rate (~25 FPS) on average on Android devices. Today we will try to improve its performance. We will use Unity Profiler, Frame Debugger, and the Stats window to analyze issues. Unity Profiler is not very accurate with specific numbers. It adds a lot of noise, which is partly fixed in Unity Standalone Profiler. But we will use the Profiler not for exact numbers, but to compare numbers as we should.
First thing first, what's the bottleneck? CPU or GPU
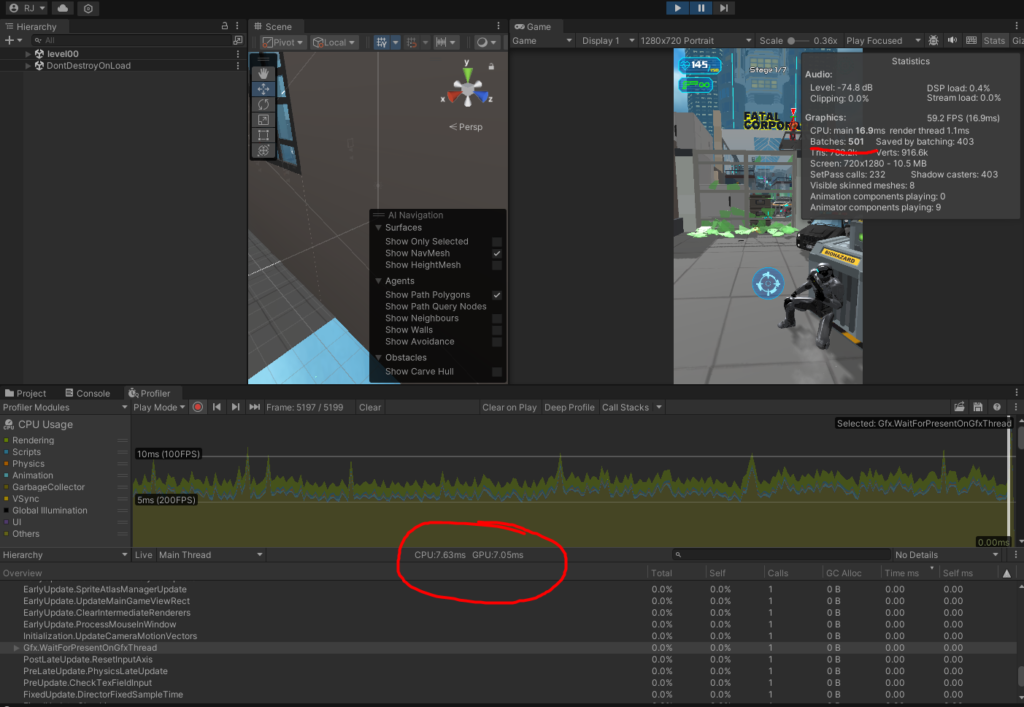
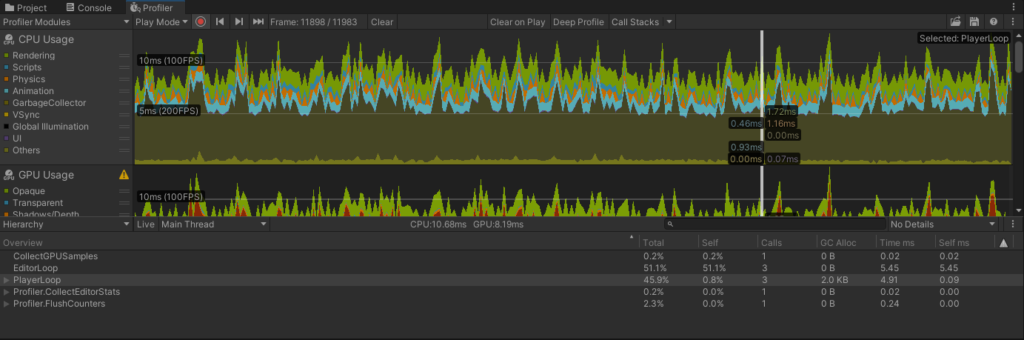
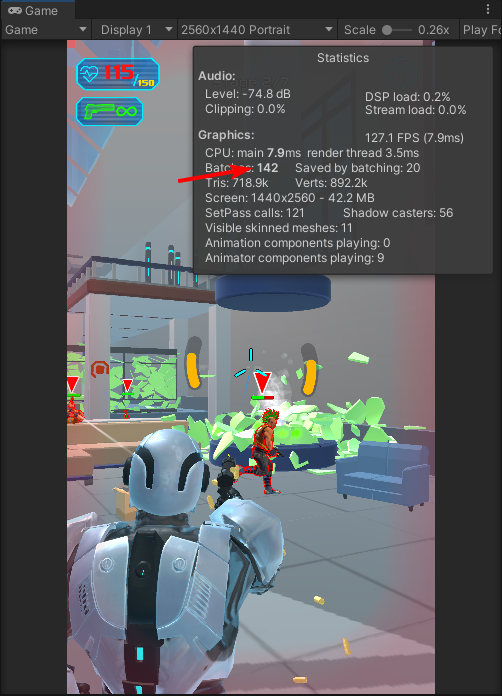
Batches are very high. So at first glance, it looks like it's CPU bound. Batches are simply groups of draw calls. A draw call is a call to the GPU to draw an object. Although it sounds like a GPU issue, but CPU actually sets up resources internally to set up the GPU. Let's open up the profiler. We need to compare the GPU and CPU frame time to make sure that it is indeed CPU-bound
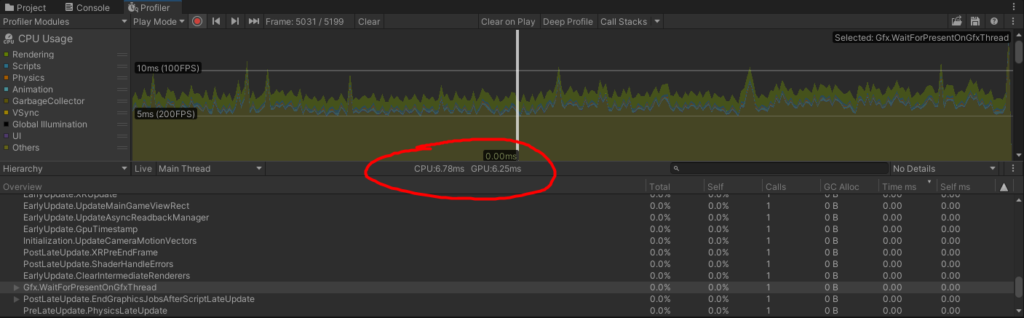
We see that both have similar times, but sometimes the CPU is going over. So we can say that we are slightly CPU bound. Note that this is the time that is needed for each frame to render. If each frame takes 9.3ms. Our frame rate becomes 108 FPS. This does not mean it's the FPS we will get always. It just means in the machine that we are working on, we are getting this because of its high specs.
On our machine at 9.3 ms, we are getting 25 FPS on mobile devices. If we want to get to 40 FPS we need around 40% performance increase. So our ideal render time would be 5.6ms. That's our target. Of course, we cannot conclusively target that exact number. But the comparison gives the general idea
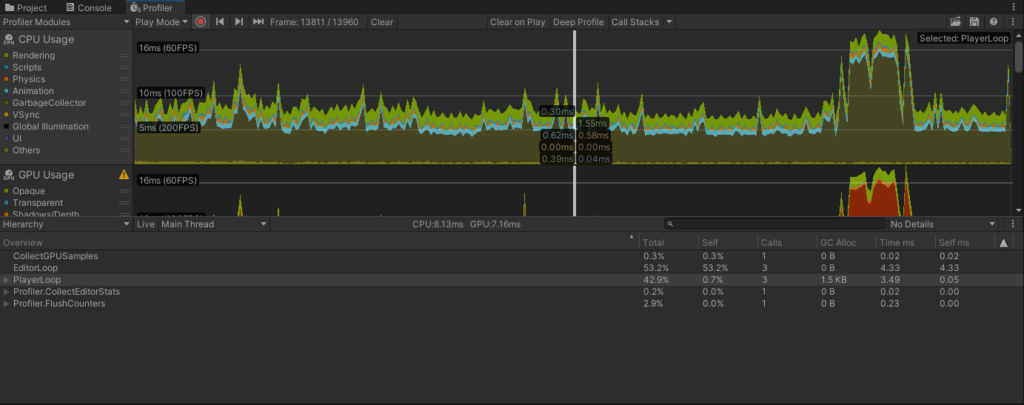
To see if we are being GPU-bound in some frames, we find the Gfx.WaitForPresent to see if it is causing any delays.
It is not causing delays which means the CPU is not waiting for the GPU. So whenever it's getting bounded by the one, it's CPU. So we'll start from there. We saw the draw calls being very high! Let's try to fix that
First, we will attempt a quick fix. Let's know a bit about skinning. It is the process by which the vertices of a skinned mesh are transformed based on the bones' animation. We have a few characters always present on the screen so we can understand that skinning is definitely happening. By default, it works on the CPU. But we can change that. If we turn on Project Settings -> Player -> Other Settings -> Compute Skinning, this will happen on the GPU. Since we are CPU-bound, it helps us.
Compute Skinning Off (default)
Compute Skinning On
We see a performance impact immediately. On average GPU takes a tiny bit more work (Compute is super fast) and the CPU finds some breathing space. It's hard to say it improved exactly by how much. But we see an overall lowering of the frame time of CPU from ~9ms to ~8ms
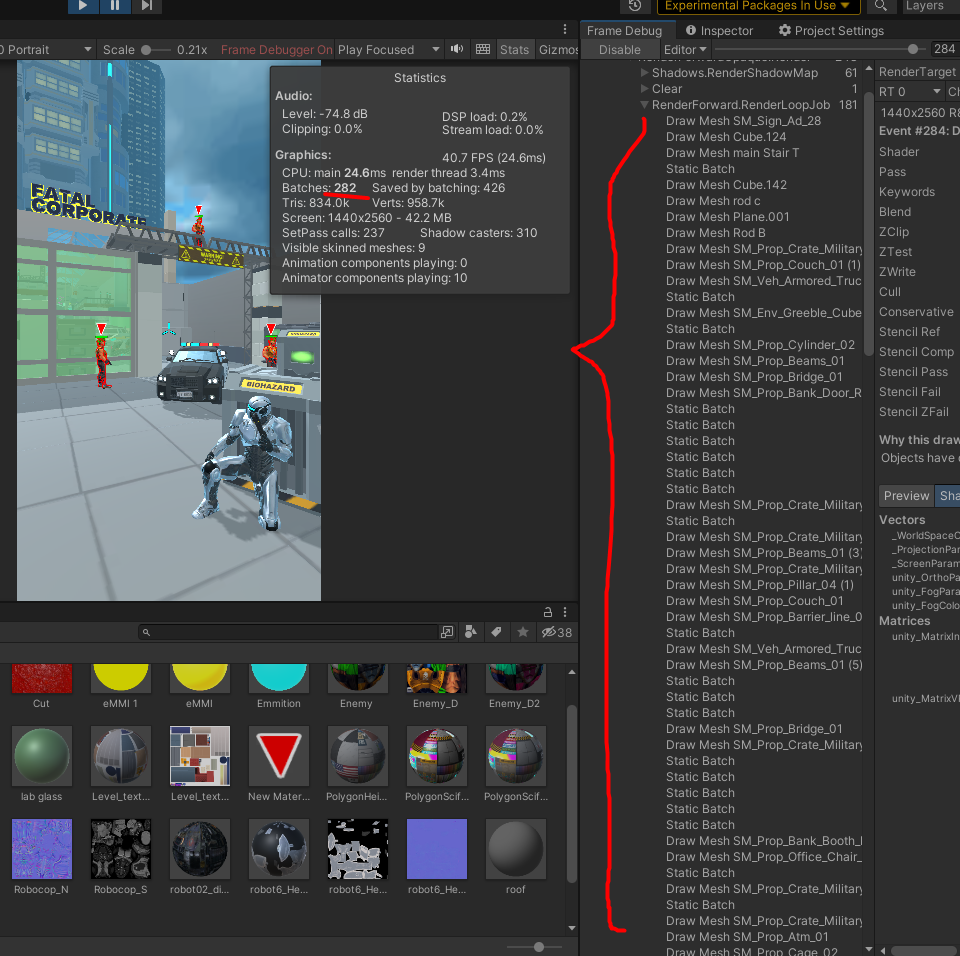
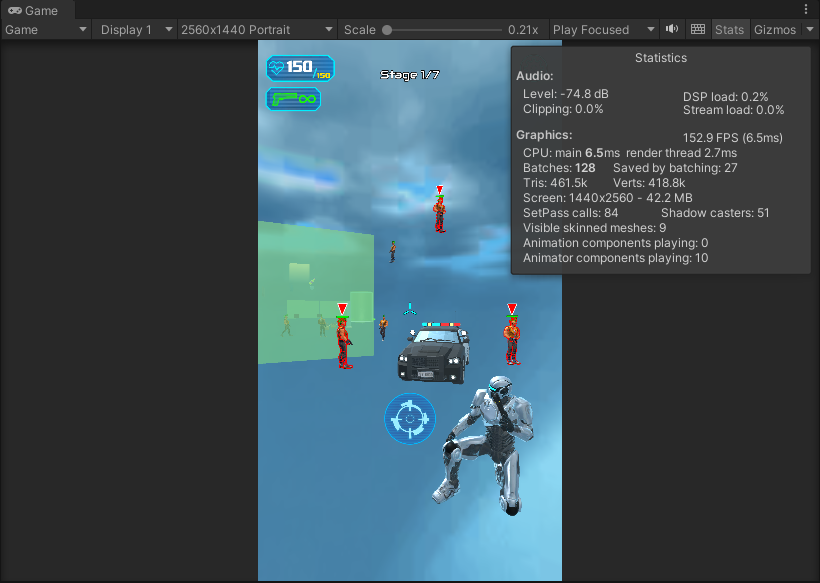
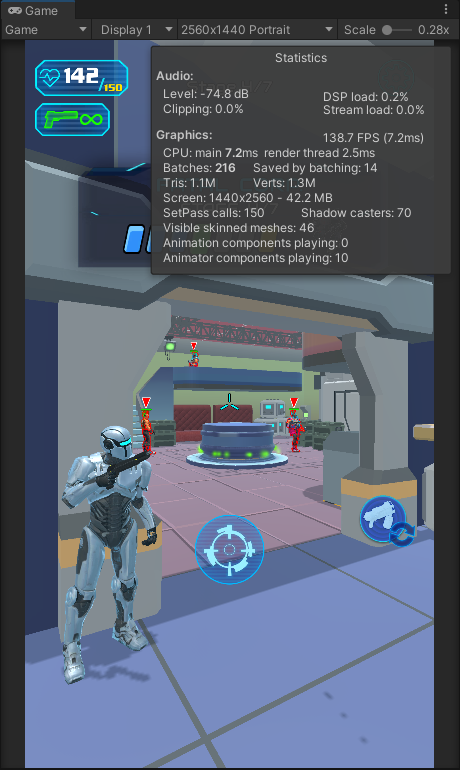
Next, we will try to improve the draw calls. We take a snapshot of our scene. We see that we have 282 batches. We aim to reduce that since it causes CPU load, (We use draw calls and batches interchangeably)
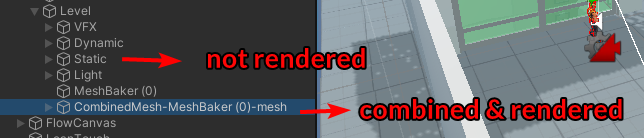
We see that a lot of objects are using static batching. We see from the hierarchy that we have a lot of static objects on the scene (also marked static).
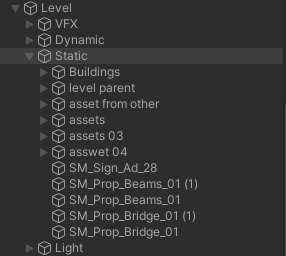
Let's reduce the draw calls required for these by combining their meshes. It should work fine since they are not moved in the scene at all. We see that if we could remove all static objects we would have a big draw call reduction (128)
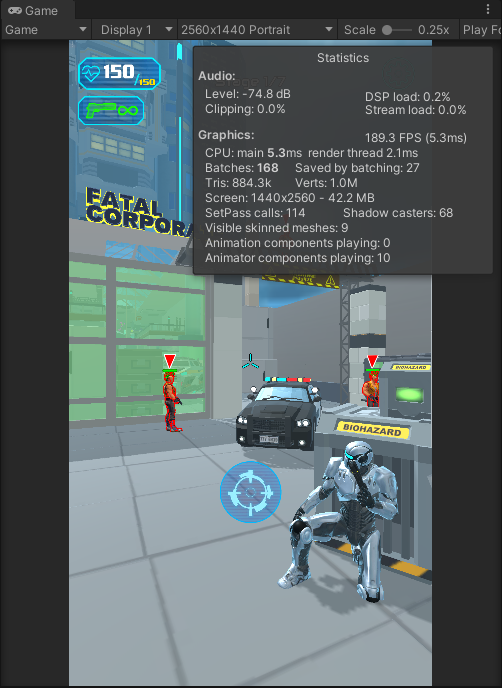
But it's not possible to remove everything, so we will try to optimize it, We will use Mesh Baker for this. First, we will combine all of the static meshes into a single one, while keeping their colliders. We immediately see the impact. The batches are now at 168 which is an immediate 40% improvement. It also reduces our CPU time by bringing it down to ~7.5ms. (Again, we can not rely on the specifics, just a comparison to see if it reduces or not)
We have a glass breaking point which causes a massive draw call spike
We will use Mesh Baker to similarly resolve this. We will additionally turn off the transparency, and shadows on the broken glasses. It is almost unnoticeable but causes significant performance overhead
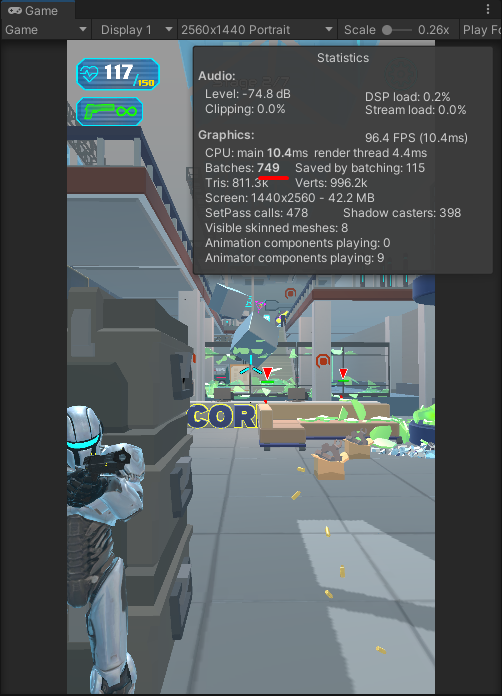
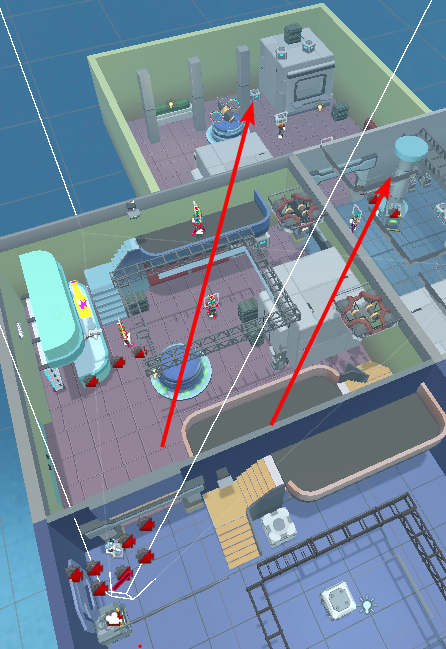
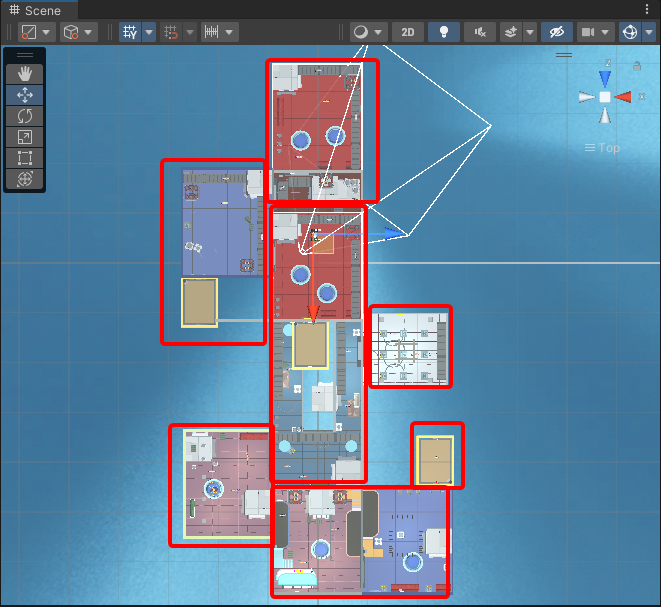
In other scenes, we have interior environments where we see high draw calls even after doing optimizations.
What happened here is that objects that are behind the walls are also being rendered
This requires Occlusion Culling with Occludee and Occluder setup. For now, we will do something simpler that works as a quick hack
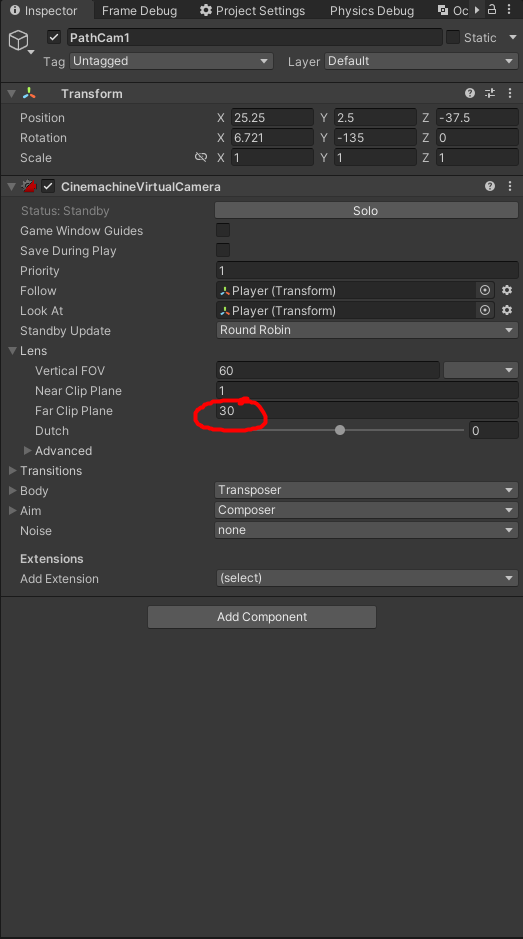
We reduce our Far Clip plan so that objects farther than 30 units are not rendered. This is a hack but ideally, we want to take time to set up occlusion culling properly. With this trick, we need to make sure that the far clip distance is not reachable by the camera i.e. there must be a wall before that distance. Otherwise, it will clip the player's vision and will look awkward
We will also go to the Quality settings and fiddle with the Shadow Distance
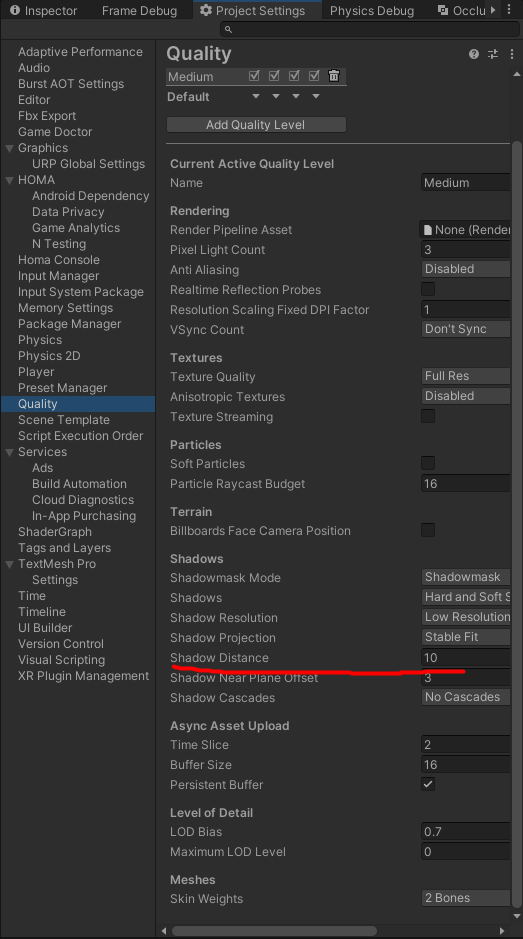
We don't want unnecessary shadows to be rendered. 10 works fine for our use case. A combination of these 2 can give ~40% draw call improvements
We combine the interior room meshes in a way so that we get low calls but also do not draw unnecessary mesh. For that, we divide it up like this for maximum performance
Finally, a lot of draw calls are taken up by the enemy characters will multiple sub-meshes. Let's try to reduce the sub-meshes as much as possible
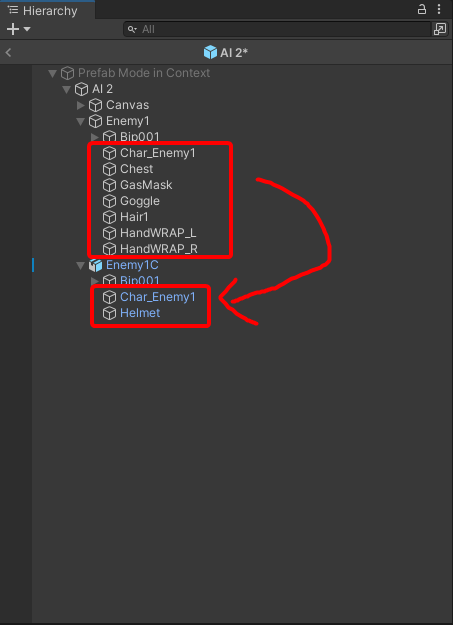
This reduces at least 5 draw calls per enemy which stacks up if also count the shadows
We now have on average 150 draw calls. It is pretty manageable for now. We see a clear improvement in spikes in our CPU times. Our CPU and GPU on average is now 6ms. Let's look into other avenues.
All of these turned the FPS average to ~40. Enough gain for a relatively short time. There are of course lots more to optimize. A big issue still is memory optimization. But that's for later. This is the general thinking of how I go about optimizing a game. Do let me know if I missed something straightforward. See you on the next one!
.